FangQuant › Commodities Futures
Part A: Review (2019/2/11-2019/2/15)
From February 11, 2019 to February 15, 2019: the closing price of the main contract of crude oil futures of INE on Friday was 444.3 yuan/barrel, 21.1 yuan higher than the closing price of the last trading day of last week. The highest price for this week is 447.6 yuan/barrel, and the lowest point is 423 yuan/barrel.
This week (2019/2/11-2019/2/15), the total volume of the main contract was 1,200,298 lots, a decrease of 573,942 lots from last week. After the close of trading this Friday, the open interest of the main contract was 29,098 lots, a decrease of 4,916 lots from the last trading day of last week.
Notes: The main contract refers to the futures contract with the maximum open interest.
Part B: Transaction Summary
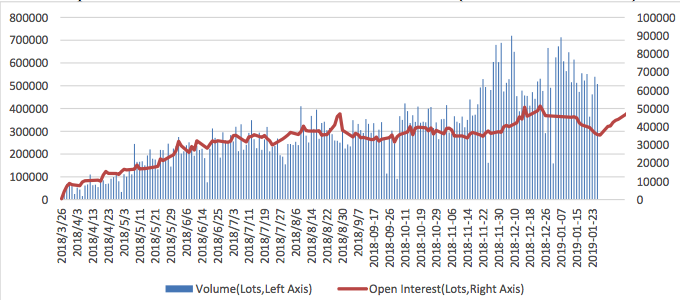
Since 2018/3/26 and up to 2019/2/15 closing, Shanghai crude oil futures’ cumulative trading volumes is 65.86 million lots, and the cumulative trading volumes of the first month of listing (2018/3/26-2018/4/25) is 1.33 million lots. The cumulative amount of transaction is 30.87 trillion yuan (2018/3/26-2019/2/15), which is 54.43 times that of the cumulative amount of the first month of listing.
Average daily turnover of the main contract is 240,060 lots (2019/2/11-2019/2/15), and average daily turnover of the main contract is 354,848 lots (2019/1/28-2019/2/1). Open interest of all the contracts of crude oil futures of INE also rised steadily, with 3,558 lots on 2018/3/26 and 84,214 lots after the closing of 2019/2/15.
Graph: Sum of All INE Crude Oil Future contracts (2018/3/26-2019/2/15)
|
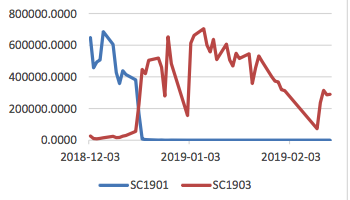
Graph: Volume (2018/12/3-2019/2/15) |
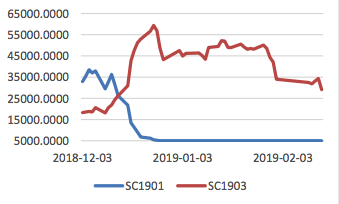
Graph: Open Interest (2018/12/3-2019/2/15) |
 |
 |
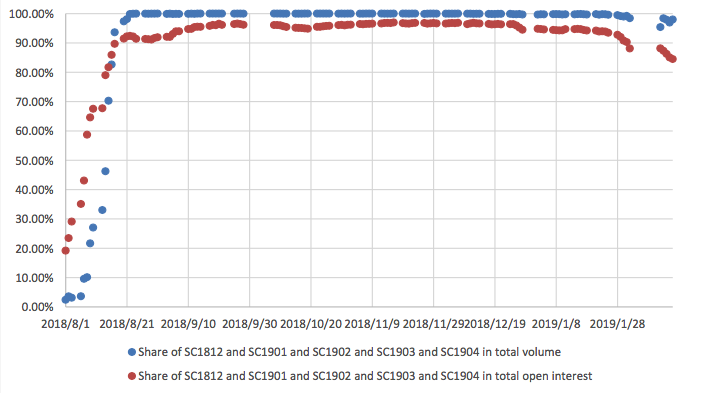
Graph: SC1812 and SC1901 and SC1902 and SC1903 and SC1904 contracts account for the most share of trading volume and open interest (2018/8/1-2019/2/15)
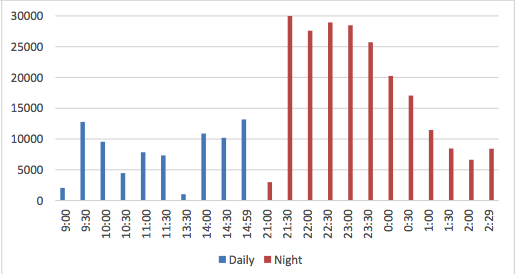
Graph: Average trading distribution over the day (2018/3/26-2019/2/15)
Graph: Daily Fluctuation Range (2018/3/26-2019/2/15)

Compared with the intra day high and low volatility of three major crude oil futures, the amplitude of Chinese crude oil futures in most of the time is lower than Brent and WTI, indicating that Chinese crude oil futures did not have excessive fluctuations in the day because of the significant speculative ratio and the short time of the market.
Graph: Volume (SC.INE and CL.NYM)
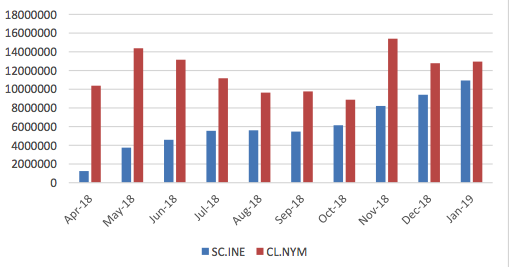
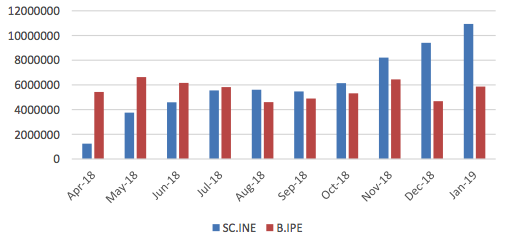
As can be seen from the above graph, since August 2018, the volume of SC.INE has exceeded the volume of B.IPE.
Part C: Correlation analysis
Graph :Price of 3 crude oil futures(in CNY,2018/3/26-2019/2/15)

Table:Correlation of three crude oil futures (2018/3/26-2019/2/15)
|
|
SC | Brent | WTI |
| SC | 1 |
|
|
| Brent | 0.943003 | 1 |
|
| WTI | 0.852016 | 0.937924 | 1 |
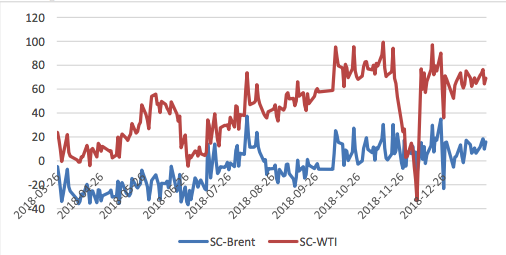
It can be seen that the SC-Brent spread was kept in a stable range, with almost no risk-free arbitrage opportunities. The spread of the price difference with WTI was huge and the high and low points were more than 100 CNY/barrel, which may due to that WTI crude oil cannot be used as the delivery of INE. Therefore, the link between SC and WTI price is not as close as that between Brent and Oman.
Table:Correlation between crude oil futures and major chemical futures in China (2018/3/26-2019/2/15)
| Correlation | Brent | WTI | asphalt | Polypropylene | Polyvinyl chloride | Pure Terephthalic Acid | Linear Low Density Polyethylene | Methanol |
| Firsr month of listing | 0.8437 | 0.8444 | 0.2435 | 0.1122 | 0.5681 | 0.9172 | -0.0234 | -0.1445 |
| Listed so far | 0.9471 | 0.8569 | 0.9387 | 0.9262 | 0.4280 | 0.6902 | 0.7188 |
0.9112 |
As can be seen from the above table, the correlation between China's crude oil futures and major domestic chemical products has been greatly improved. The correlation with Polypropylene increased from 11.22% in the first month of listing to 92.16%, and asphalt increased from 24.35% to 96.59%, the trend of PTA is also very close to SC. On the one hand, the substantial increase in correlation will stimulate the continuous influx of arbitrage funds, which will help to enrich and optimize the strategy; On the other hand, it is also a sign that China's crude oil futures market is maturing, which is conducive to the function of price discovery. It also has great significance for enterprises to use futures tools for hedging.
Graph: SC.INE close price and USD/CNY (2018/3/26-2019/2/15)
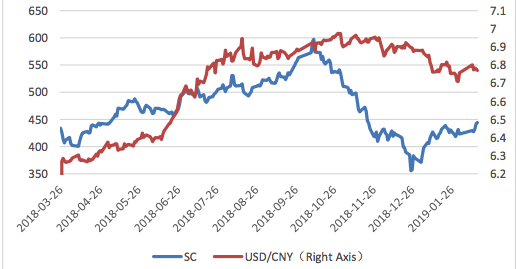
It can be seen that China's crude oil futures and the RMB exchange rate are obviously negatively correlated.
Part D: Spread analysis
Graph :Price Difference(in CNY, 2018/3/26-2019/2/15)
Graph :SC -Oman(in CNY,2018/3/26-2018/9/19)

Graph :SC - Brent(in CNY, 2018/3/26-2019/2/15)

Graph :SC - WTI(in CNY, 2018/3/26-2019/2/15)

Copyright byfangquant.com
Currently no Comments.
Hot Topics
The 13rd China International Future Forum
The Shanghai Derivatives Energy Forum has received extensive attention from relevant industries both within and outside the borders.
Financial institutions deep explore commodity market opportunities, commodity index financial products show full-scale trend
R-Code for analysis: getKDJ
R-Code@June 06, 2016
New indicator to analyze the arbitrage opportunities between sse50 and csi500
Market review: January 11, 2017
The Great China Bubble: Anniversary Lessons and Outlook
Quant Investment in China A-share market
The hedge strategy between SSE50 and A50--Jan 13,2017
The arbitraging strategy between CSI300 and SSE50
Market review: June 17, 2016
Sleepless in London--Enda Homan(Allied Irish Banks Plc)
MSCI Rebuffs Chinese Equities for Third Time in Blow to Xi
Soros, Druckenmiller among hedgies profiting in market plunge