FangQuant › Commodities Futures
Part A: Review (2019/1/21-2019/1/25)
From January 21, 2019 to January 25, 2019:the closing price of the main contract of crude oil futures of INE on Friday was 430.8 yuan/barrel, 1.2 yuan lower than the closing price of the last trading day of last week. The highest price for this week is 442.2 yuan/barrel, and the lowest point is 421.5 yuan/barrel.
This week (2019/1/21-2019/1/25), the total volume of the main contract was 2,389,196 lots, a decrease of 257,606 lots from last week. After the close of trading this Friday, the open interest of the main contract was 48,172 lots, a decrease of 758 lots from the last trading day of last week.
Notes: The main contract refers to the futures contract with the maximum open interest.
Part B: Market Dynamics
1. Shandong spot crude trade surges, prices rise
Spot crude prices are rising on China's Shandong market, with strong demand for March crude arrivals.
More than 1.4mn b/d of crude for March delivery has traded on the Shandong spot market this month, an increase of around 300,000 b/d from the amount traded in last month for February-arrival. Premiums are nudging higher, too. Premiums for Russian ESPO Blend and Congolese Djeno delivered ex-ship (des) to Shandong are up by $0.50/bl this week compared with levels traded on 14-15 January, at $2.90/bl and $1.60/bl, respectively.
Premiums for Brazilian Lula have risen more modestly, by $0.13/bl over the same period, to $1.75/bl. But the market is trading Lula cargoes for delivery in April against Ice June Brent, which is pricier than the May contract basis for Djeno and ESPO Blend trade.
Lula in like-for-like terms is $0.25/bl more expensive than competing medium-sweet Djeno — a relatively modest premium, making the grade highly attractive. On a gross product worth (GPW) basis the Brazilian grade is worth around $1.40/bl more to refiners in Shandong, Argusestimates. This is reflected in the volume of spot trade. Around 550,000 b/d of Lula has changed hands for March delivery this month and, already, 170,000 b/d for delivery in April.
Shandong crude receipts this month are already looking far higher than originally expected, at around 3.6mn b/d. There are lengthy queues of tankers waiting to discharge outside key ports in the province — five 2mn bl very large crude carriers (VLCCs) are waiting to discharge off Huangdao and five are outside Dongjiakou. This is raising concerns about still-longer delays — and potential demurrage costs — at the end of the first quarter, in March-April, when crude bought in January starts arriving.
Backwardation again:
Crude prices have risen in response to the Opec/non-Opec decision to cut production — led by Saudi Arabia, which lowered output by more than 500,000 b/d last month and may cut further, by nearly 400,000 b/d, this month. This is supporting prices for sour crude relative to those for sweet marker North Sea Dated, and is compressing the premium of Ice Brent to Mideast Gulf marker, Dubai, known as the EFS. The EFS is below $1/bl, boosting the appeal of Atlantic basin crude over Dubai-linked sour grades, and pushing up the cost of sending Dubai-linked ESPO Blend to Shandong. Ice Brent futures have pushed into backwardation at the front end of the curve. The front-month March contract settled at a premium to Ice April Brent for two consecutive sessions on 17-18 January, for the first time since early November.
Product markets:
Chinese product markets remain weak. Shandong retailers have some concerns about the need for stocks to tide them through the likely surge in passenger-vehicle use over the lunar new year public holidays in mid-February. This has helped push gasoline and diesel spot prices $2.30/bl above levels a week ago, but the outlook for diesel is weak. Many factories will shut for the holidays, and an accident at a mine in Shaanxi province on 12 January has prompted authorities to suspend operations pending safety checks, further curbing industrial diesel use.
The fuel oil rally appears to be petering out, which is likely to reduce demand for fuel-oil rich crude grades such as Djeno. Fuel oil's discount to crude is widening in all regions, although its discount remains smaller in Singapore than in northwest Europe or on the US Gulf coast.
Part C: Transaction Summary
Since 2018/3/26 and up to 2019/1/25 closing, Shanghai crude oil futures’ cumulative trading volumes is 62.63 million lots, and the cumulative trading volumes of the first month of listing (2018/3/26-2018/4/25) is 1.33 million lots. The cumulative amount of transaction is 29.48 trillion yuan (2018/3/26-2019/1/25), which is 51.98 times that of the cumulative amount of the first month of listing.
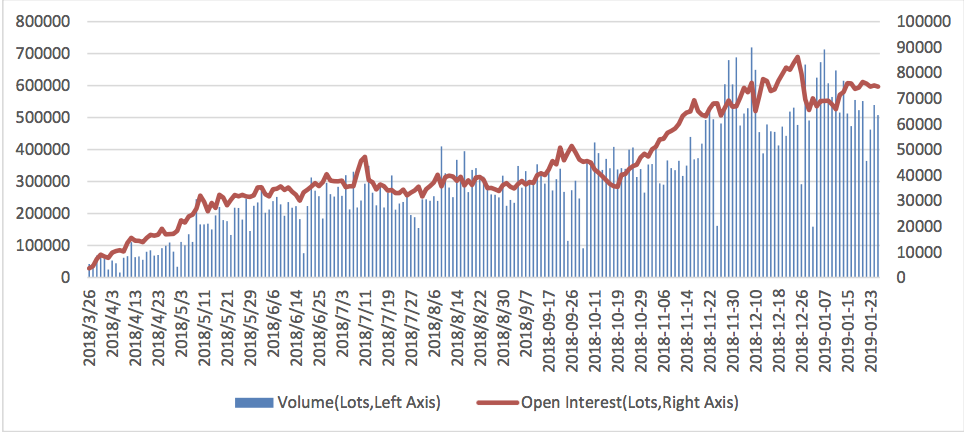
Average daily turnover of the main contract is 477,839 lots (2019/1/21-2019/1/25), and average daily turnover of the main contract is 529,360 lots (2019/1/14-2019/1/18). Open interest of all the contracts of crude oil futures of INE also rised steadily, with 3,558 lots on 2018/3/26 and 74,616 lots after the closing of 2019/1/25.
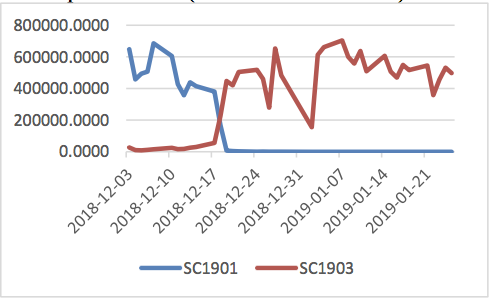
Graph: Sum of All INE Crude Oil Future contracts (2018/3/26-2019/1/25)
|
Graph: Volume (2018/12/3-2019/1/25) |
Graph: Open Interest (2018/12/3-2019/1/25) |
 |
 |
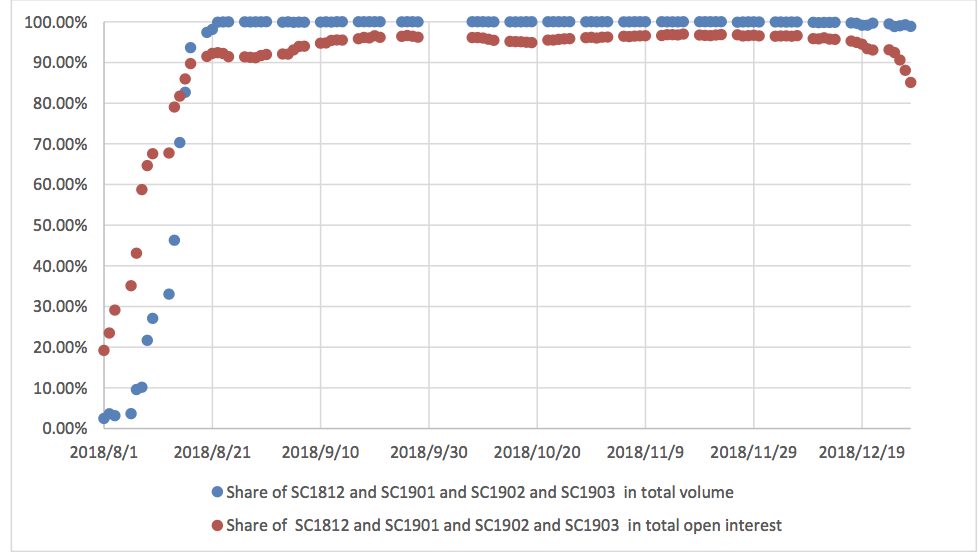
Graph: SC1812 and SC1901 and SC1902 and SC1903 contracts account for the most share of trading volume and open interest (2018/8/1-2019/1/25)
Graph: Average trading distribution over the day (2018/3/26-2019/1/25)

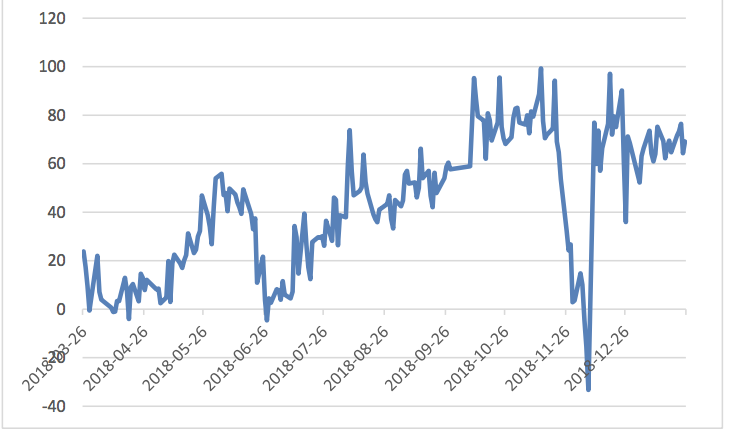
Graph: Daily Fluctuation Range (2018/3/26-2019/1/25)

Compared with the intra day high and low volatility of three major crude oil futures, the amplitude of Chinese crude oil futures in most of the time is lower than Brent and WTI, indicating that Chinese crude oil futures did not have excessive fluctuations in the day because of the significant speculative ratio and the short time of the market.
Graph: Volume (SC.INE and CL.NYM)

Graph: Volume (SC.INE and B.IPE)
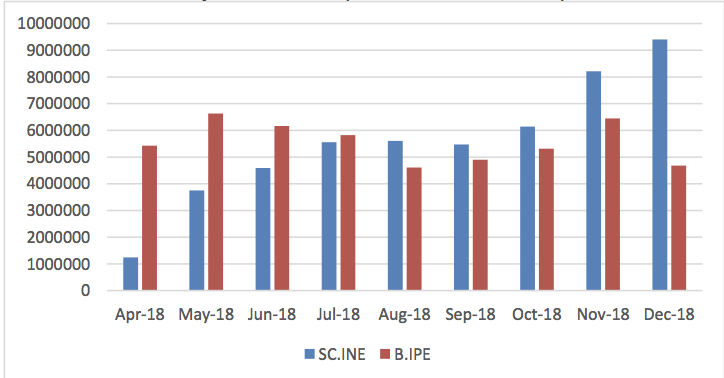
As can be seen from the above graph, since August 2018, the volume of SC.INE has exceeded the volume of B.IPE.
Part D: Correlation analysis
Graph :Price of 3 crude oil futures(in CNY,2018/3/26-2019/1/25)
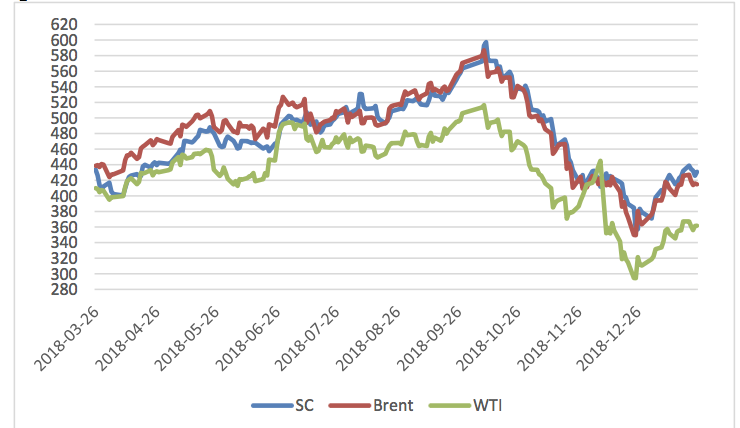
Table:Correlation of three crude oil futures (2018/3/26-2019/1/25)
|
|
SC | Brent | WTI |
| SC | 1 |
|
|
| Brent | 0.941846 | 1 |
|
| WTI | 0.847521 | 0.93419 | 1 |
It can be seen that the SC-Brent spread was kept in a stable range, with almost no risk-free arbitrage opportunities. The spread of the price difference with WTI was huge and the high and low points were more than 100 CNY/barrel, which may due to that WTI crude oil cannot be used as the delivery of INE. Therefore, the link between SC and WTI price is not as close as that between Brent and Oman.
Table:Correlation between crude oil futures and major chemical futures in China (2018/3/26-2019/1/25)
| Correlation | Brent | WTI | asphalt | Polypropylene | Polyvinyl chloride | Pure Terephthalic Acid | Linear Low Density Polyethylene | Methanol |
| Firsr month of listing | 0.8437 | 0.8444 | 0.2435 | 0.1122 | 0.5681 | 0.9172 | -0.0234 | -0.1445 |
| Listed so far | 0.9461 | 0.8525 | 0.9625 | 0.9253 | 0.4114 | 0.7167 | 0.7085 | 0.9084 |
As can be seen from the above table, the correlation between China's crude oil futures and major domestic chemical products has been greatly improved. The correlation with Polypropylene increased from 11.22% in the first month of listing to 92.16%, and asphalt increased from 24.35% to 96.59%, the trend of PTA is also very close to SC. On the one hand, the substantial increase in correlation will stimulate the continuous influx of arbitrage funds, which will help to enrich and optimize the strategy; On the other hand, it is also a sign that China's crude oil futures market is maturing, which is conducive to the function of price discovery. It also has great significance for enterprises to use futures tools for hedging.
Graph: SC.INE close price and USD/CNY (2018/3/26-2019/1/25)
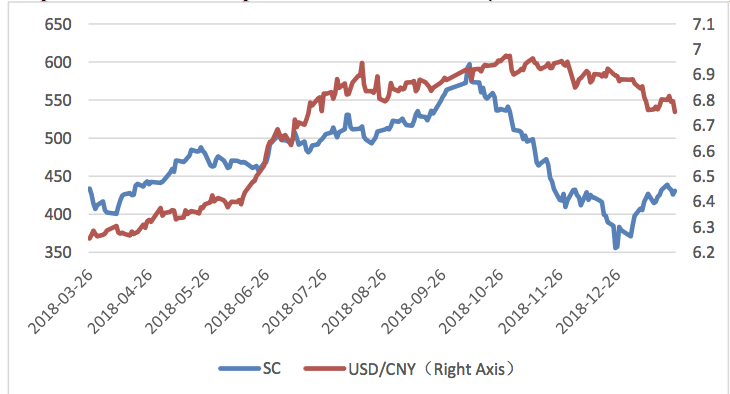
It can be seen that China's crude oil futures and the RMB exchange rate are obviously negatively correlated.
Part E: Spread analysis
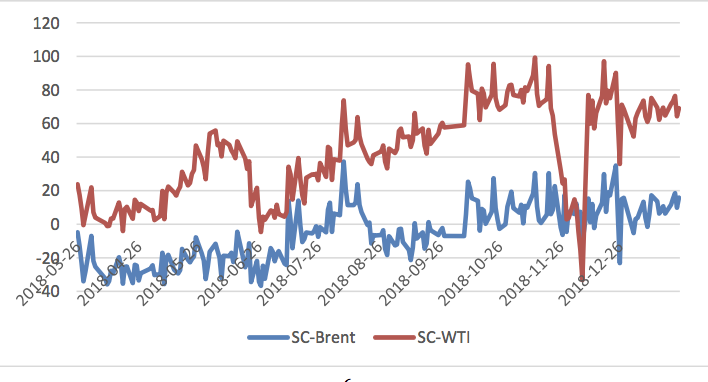
Graph :Price Difference(in CNY, 2018/3/26-2019/1/25)
Graph :SC -Oman(in CNY,2018/3/26-2018/9/19)

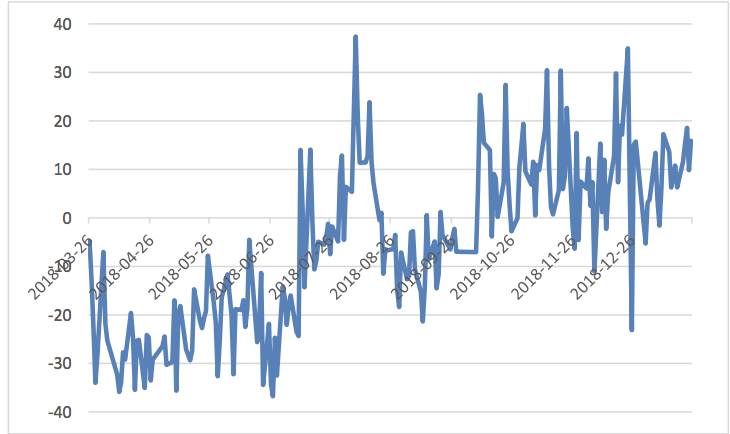
Graph :SC - Brent(in CNY, 2018/3/26-2019/1/18)
Graph :SC - WTI(in CNY, 2018/3/26-2019/1/18)
Copyright by Fangquant.com
Currently no Comments.
Hot Topics
The 13rd China International Future Forum
The Shanghai Derivatives Energy Forum has received extensive attention from relevant industries both within and outside the borders.
Financial institutions deep explore commodity market opportunities, commodity index financial products show full-scale trend
R-Code for analysis: getKDJ
R-Code@June 06, 2016
New indicator to analyze the arbitrage opportunities between sse50 and csi500
Market review: January 11, 2017
The Great China Bubble: Anniversary Lessons and Outlook
Quant Investment in China A-share market
The hedge strategy between SSE50 and A50--Jan 13,2017
The arbitraging strategy between CSI300 and SSE50
Market review: June 17, 2016
Sleepless in London--Enda Homan(Allied Irish Banks Plc)
MSCI Rebuffs Chinese Equities for Third Time in Blow to Xi
Soros, Druckenmiller among hedgies profiting in market plunge